Deep topographic proteomics of a human brain tumour
Deep topographic proteomics of a human brain tumour
The cellular composition and spatial organization of tissues play a crucial role in determining their identity and function. Understanding these features is essential for studying disease outcomes. Recent advancements in spatially-resolved sequencing technologies have allowed for the characterization of gene expression patterns within tissues. However, to fully comprehend tissue heterogeneity, it is also necessary to consider the proteins encoded by the genes. Mass spectrometry imaging (MSI) techniques can map protein distribution in tissues but have limitations in generating comprehensive proteome data. Laser capture microdissection (LCM) offers a promising solution as it allows for the extraction of specific regions from tissues, ranging from single cells to larger tissue areas.
Recently, Simon Davis et al. from Oxford used laser capture microdissection to analyze the proteome of a human brain tumor at different spatial resolutions, ranging from an entire tissue section to 40 µm resolution. The main objective was to develop a workflow for deep proteomics and spatially-aware statistics to discover tissue features, rather than focusing on the specific biology of the brain tumor. By applying spatially-aware statistical methods, they identified proteins and pathways with differential spatial and clustered expression within the tumor sections, without prior knowledge of tissue structures or pathology. Additionally, they discovered spatially-defined proteo-phenotypes within the tumor, revealing spatially-resolved extracellular matrix biology and a focused immune response at the tumor periphery. Moreover, they mapped protein abundances in relation to the vascular fine structure, providing insights into the nutrient and oxygen-dependent spatial proteome within cancerous tissue. This study demonstrates the potential of deep topographic proteomics combined with spatially-aware analysis to identify areas of interest related to disease mechanisms.
The methods of their work
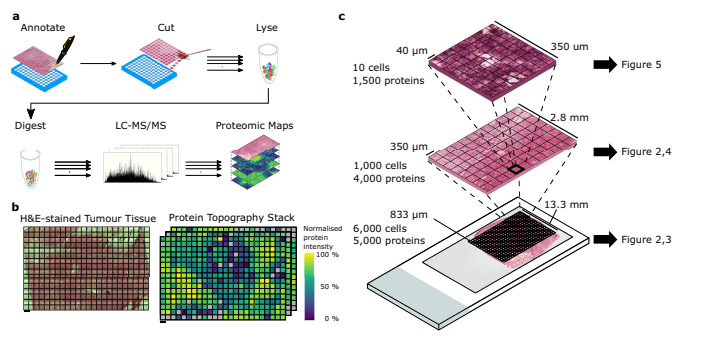
Post-mortem brain tissue from a tissue donor was obtained with proper consent and stored at the Oxford Brain Bank. The brain was sectioned and the tumorous tissue was isolated from the first and second coronal slices. Cryosections were taken from different parts of the tumor to determine the section with the best preservation. The upper-right quadrant of the second coronal slice was chosen for further experiments. The tissue blocks were prepared for laser-capture microdissection by mounting them onto slides and staining them with H&E.
Tissue analysis was conducted using laser-capture microscopes equipped with laser pressure catapulting, specifically the PALM Microbeam and Leica LMD7 systems. The PALM Microbeam was used for the 10x objective lens analysis, while the LMD7 was used for the 20x objective lens analysis. The Microbeam’s cutting and capturing settings were Energy: 43 and Focus: 55 for cutting, and Energy: 20 and Focus: -15 for capturing. The samples collected from both systems were stored at -80 °C until further use. For the LMD7 system, tissue areas were microdissected and transferred to wells of a 96-well PCR plate, treated with acetonitrile, and then stored at -20 °C until further processing.
The samples were thawed, briefly centrifuged, and rinsed with RIPA buffer containing Benzonase to collect any remaining tissue. Proteins were then reduced and alkylated before being mixed with paramagnetic SP3 beads. The samples were subjected to acetonitrile treatment and shaken to immobilize the beads on a magnet. After washing, the beads were resuspended, digested with trypsin overnight, and then sonicated. Acetonitrile treatment and magnet immobilization were repeated before transferring the peptides to vials or plates. For the 40 µm resolution data, a single-step digestion was performed using a digestion buffer containing n-dodecyl-β-D-maltoside and Trypsin/LysC Mix. The resulting peptides were loaded onto C18 tips for LC-MS/MS analysis.
Peptides from samples with resolutions of 833 µm, 350 µm, and 40 µm were analyzed using different LC-MS/MS systems. For the 833 µm resolution, a Dionex Ultimate 3000 coupled to a timsTOF Pro was used, with a 75 μm x 150 mm C18 column and a flow rate of 400 nL/min. A 17-minute linear gradient from 2% buffer B to 30% buffer B was applied, and the mass spectra were recorded in the 100–1700 m/z range. In the case of the 350 µm resolution, a Dionex Ultimate 3000 coupled to an Orbitrap Fusion Lumos was used, with a 75 µm x 500 mm C18 column and a flow rate of 250 nL/min. A 60-minute linear gradient from 2% buffer B to 35% buffer B was applied, and MS1 scans were acquired in the 400–1500 m/z range. As for the 40 µm resolution, an Evosep One LC system coupled to a timsTOF SCP mass spectrometer was used, with a 75 µm x 150 mm C18 column and a flow rate of 1.07 seconds per cycle. The diaPASEF frames were separated into 3 ion mobility windows covering the 400–1000 m/z mass range.
What did they find
The researchers described their workflow for spatially-resolved proteomics on an atypical teratoid-rhabdoid tumour (AT/RT). They obtained a 10 µm thick section of the tumour block and divided it into 384 square ‘voxels’ for analysis. Each voxel was isolated using laser capture microdissection (LCM) and processed with their LCMSP3 protocol. They were able to identify 5321 proteins, with varying numbers of proteins identified per sample, including empty voxels. The identified proteins were then mapped back to their original positions within the tissue grid. Four example proteins were shown to have different expression patterns within the tumour section. Spatial autocorrelation analysis was performed on 4306 quantified proteins and 3212 proteins demonstrated correlated spatial expression. The researchers ensured that there was no sampling bias and that protein abundance differences were mostly compositional. To increase spatial resolution, they focused on a specific region within the tumor and quantified 3994 proteins in 96 smaller voxels. The expression patterns of the four example proteins in this region were consistent with the larger field-of-view data. Further validation of the spatially-resolved protein expression data was performed using immunohistochemistry staining on three selected proteins. The staining patterns closely resembled the protein intensity distributions within the proteomic maps.
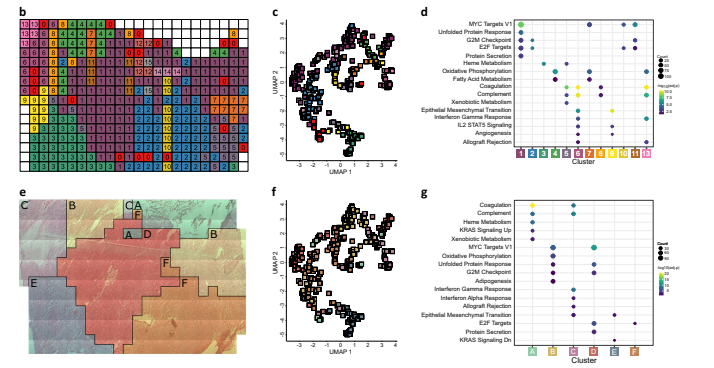
The margin between solid tumour and brain/tumour interface in AT/RT was analyzed using a clustering approach that generated distinct spatially-defined areas based on protein quantitation data. The clusters identified in this approach were consistent with the spatial clusters observed in UMAP visualization. Marker proteins for each cluster were determined to investigate their functional differences. Clusters 1 and 2, representing the solid tumour, showed enrichment for proliferative hallmarks, while clusters 6 and 13, neighboring clusters in the upper-left region, were enriched for immune-related hallmarks. Cluster 9, located on the boundary of the tumour, showed enrichment of hallmarks related to angiogenesis and epithelial-mesenchymal transition, suggesting active tumour infiltration. Analysis of immune cell-marker proteins revealed localization of neutrophil markers and pro-tumour M2 macrophage markers in clusters 13 and 6, respectively. Spatial clustering using an integrated proteomic and spatial similarity approach resulted in six clusters, which encompassed solid tumour, brain/tumour interface, immune infiltration, and haemorrhage. These clusters showed enrichment for specific hallmarks related to their respective functions. The clustering results were consistent when analyzed at different spatial resolutions. Overall, the clusters identified in this study help define functional layers at the tumour periphery in AT/RT, highlighting differences in protein abundance and functional processes between solid tumour, interface, and surrounding areas.
The researchers focused on a specific area within the tumor tissue that contained four blood vessels represented by a single voxel. They used a higher spatial resolution of 350 µm to analyze the protein abundance patterns and their relationship to nutrient and oxygen gradients. The region was further divided into a 9-by-9 grid, resulting in a spatial resolution of 40 µm. Each voxel of this size contained between 5 and 10 visible nuclei, and a total of 1550 proteins were quantified using data-independent analysis. The researchers measured the distance of each cell to the nearest blood vessel and found a positive correlation between blood proteins and proximity to blood vessels. After spatial clustering, the tissue was segmented into four clusters based on their proximity to blood vessels. Enrichment analysis revealed that cluster 1, further from the vessels, showed enrichment of the “Oxidative Phosphorylation” term, while clusters 2 and 4, closer to the vessels, showed enrichment of terms related to blood. The researchers observed consistent intensity of the protein GAPDH across the tissue. Proteomic maps showed two main patterns: proteins positively correlated with voxel:blood vessel distance and proteins negatively correlated with voxel:blood vessel distance. The researchers identified several proteins, such as Alpha-2-Macroglobulin and Aspartate beta, which correlated with blood vessels and exhibited specific spatial distributions. They also noticed the presence of many extracellular matrix-related proteins, which were spatially correlated and enriched in pathways related to ECM architecture. The researchers further analyzed the spatial abundance of collagen proteins and integrin proteins, which showed heterogeneity across different subfamilies within the tissue. Proteins associated with the ECM showed higher spatial clustering than non-ECM proteins. Overall, this spatial analysis provided insights into the distribution of proteins, nutrient/oxygen gradients, and the role of the ECM in tumor development within the tumor tissue.
Their conclusions
This study uncovered spatial abundance patterns of proteins within the tumor and identified specific proteins that serve as spatial markers for the tumor boundary. Additionally, the study revealed immune response-driven protein networks in the extracellular tumor matrix and demonstrated the potential of deep topographic proteomics to redefine our understanding of tissue biology and pathology at the molecular level. This study also discusses the limitations and challenges of current spatially-resolved proteomic techniques and proposes future directions for research.